Those familiar with the university technology transfer sector will appreciate that many people hold strong views on the optimal methods for spinouts, irrespective of their experience in the field. Despite being a relatively rare occurrence, with around 150 companies spinning out a year in the UK, a considerable amount of commentary has been dedicated to this topic. Although these discussions are beneficial, they often revolve around common themes and well-established viewpoints.
Investors are often concerned about the negative impact of universities taking large equity stakes on the long-term motivation of the founding team. This can be exacerbated if academic founders also receive equity but do not join the management team. These concerns are countered by university representatives, who argue that such accounts are anecdotal and, therefore, not representative of the overall picture. It is worth acknowledging that this pattern of dialogue is also anecdotal.
Both parties make valid points: these instances do occur, and anecdotal evidence lacks robustness. So, the question arises: can we move beyond the anecdotal to determine how common this really is? The answer is yes. Data on this subject does exist, although it is usually presented in terms of averages. The Royal Academy of Engineering’s Spotlight on Spinouts report also uses averages and standard deviation as its primary statistical measures.
This article provides an expanded analysis of the equity stakes held by universities in academic spinouts that looks beyond measures of central tendency, broadening the scope of the annual Spotlight on Spinouts report. The methodology includes all spinouts since 2011, irrespective of the university's stake, thereby providing a more comprehensive picture—though with some important caveats. Although reliant on the annual confirmation statements filed by companies, the findings offer insight into the changing landscape of university spinout equity allocation and its implications on investor confidence and spinout survival.
Introduction to the analysis
The Spotlight on Spinouts report features an analysis of the equity stakes taken by universities in academic spinout companies. The analysis in Spotlight on Spinouts uses the earliest equity stake taken by a university based on the spinout company’s confirmation statement as filed at Companies House. The methodology employed in the report excludes spinouts where the university does not take an equity stake or where the equity stake is greater than 50%.
However, the methodology that underlies the analysis in this article expands the underlying group of companies to include all spinout companies incorporated since 1st January 2011, regardless of whether these companies have no university shareholders or university shareholders with greater than 50% equity stakes. The differing methodologies are summarised in Table 1.
The Spotlight on Spinouts methodology omits instances where the university has not taken an equity stake, an approach similar to that employed in research from the University of Oxford’s Saïd Business School. For emerging spinouts, there is a delay between the company's formation and the filing of an annual confirmation statement reflecting a university's equity interest. Thus, spinouts that initially seem to lack a university stake (or present no data at all) may, after several years, show a university entity on their capitalisation table. Older spinouts without university stakes are excluded in the Spotlight on Spinouts methodology because unequivocal zero values are not deemed relevant to the core debate around equity stakes. This debate focuses on the idea that when universities take stakes, the stakes are often excessively high. Incorporating companies without a university stake would skew average measurements downward, failing to accurately represent the typical stake size when a stake is taken. By design, excluding these companies from the dataset does diminish insight into how often a university chooses not to take a stake. This analysis incorporates companies without university shareholders to provide a more comprehensive view less centred on averages.
The Spotlight on Spinouts methodology also excludes companies where the university takes an equity stake greater than 50%. This is because these entities would not usually be considered independent companies because the university holds a controlling stake, making such companies subsidiaries of the university. For this analysis, companies with a university shareholding of greater than 50% have been included. Anecdotally, many universities consider such companies to still be spinouts rather than subsidiaries and may not actually enforce their controlling vote except in the most significant decisions. We are interested in hearing more from founders at companies where a university has a majority equity stake.
| Analysis |
University takes no stake |
University takes a stake between 0% and 50% | University takes a greater than 50% stake |
|
Spotlight on Spinouts |
Excluded | Included | Excluded |
|
Enterprise Fellowships |
Included | Included |
Included 2016 - 2018 Excluded 2019 - 2023 |
|
Mapping equity (this article) |
Included | Included | Included |
Table 1: Methodological approaches to different university equity stakes
While the dataset that underlies this analysis is an expanded version of the data that underlies the Spotlight on Spinouts report, it still has some of the same limitations. The dataset relies on companies’ confirmation statements that are filed once a year with Companies House. These provide a snapshot of a company’s shareholders when filing but do not necessarily account for changes to shareholdings between filings.
Frequency of university stakes in the spinout population

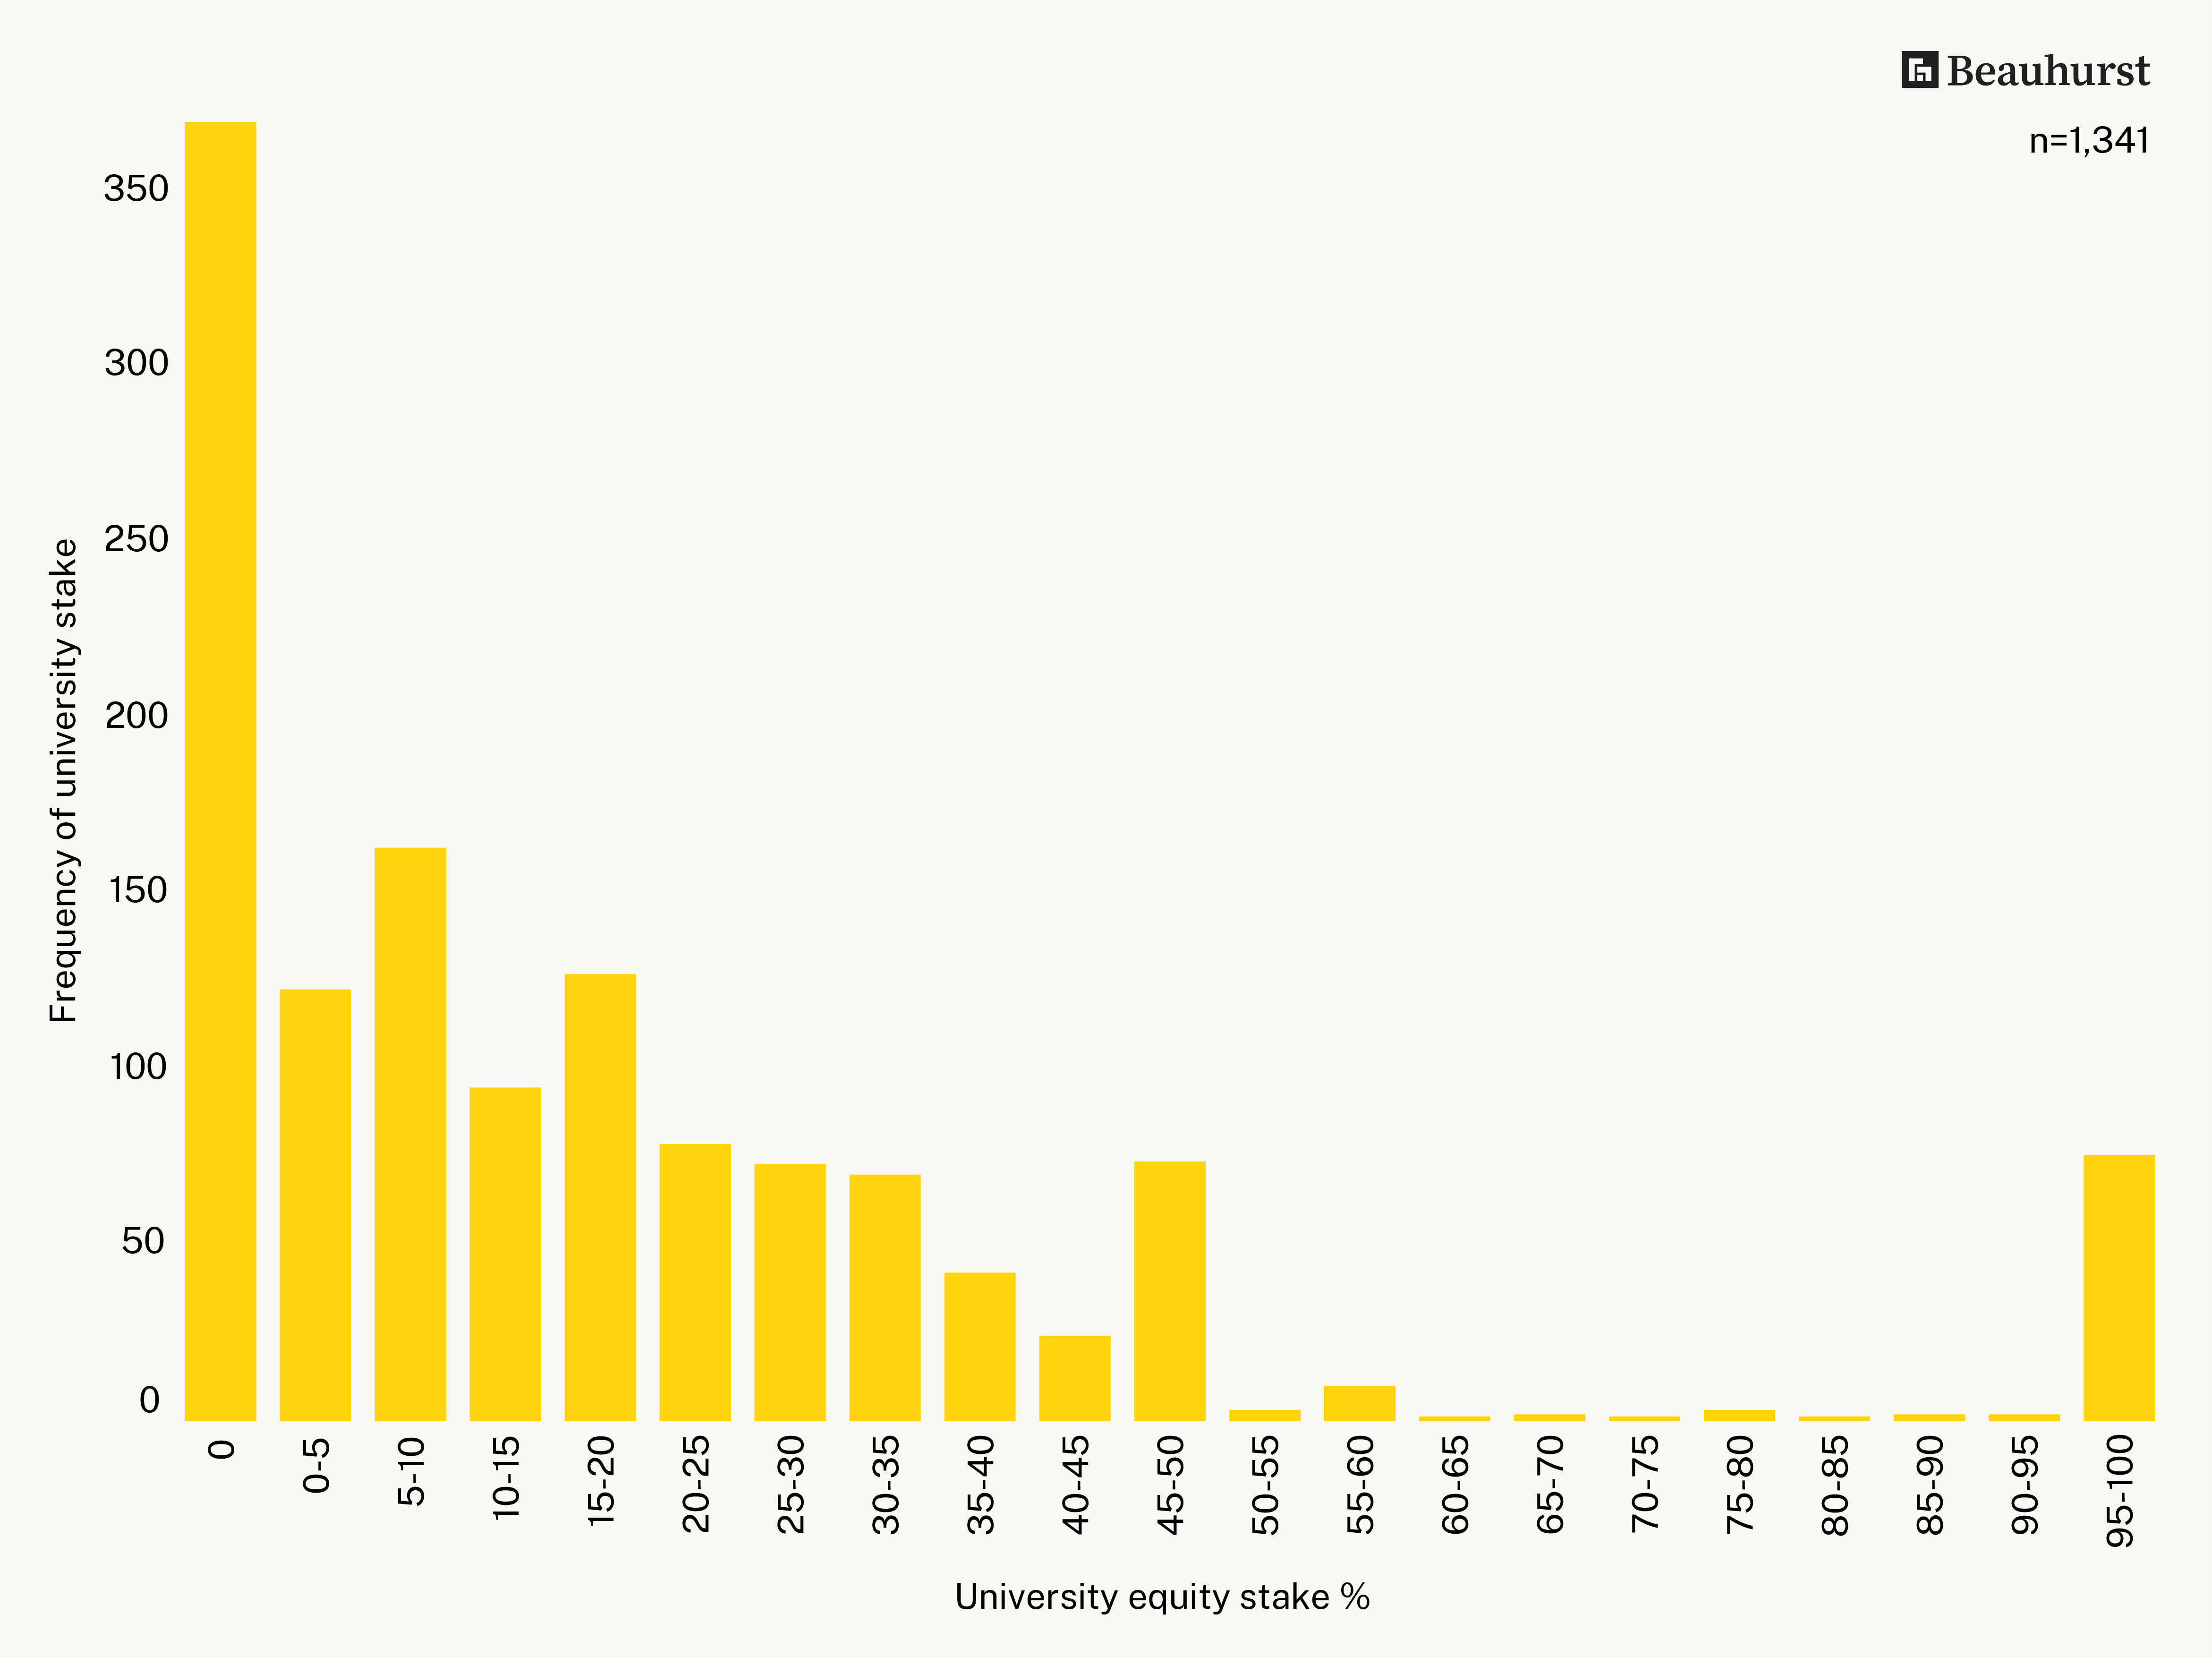
Figure 1 - Frequency of university stakes
This analysis assesses the equity stakes of 1,341 spinout companies incorporated between the 1st of January 2011 and the 30th of May 2023. In Figure 1, companies are categorised by the magnitude of the equity stakes held by the origin academic institution in 5% intervals. Among these categories, companies with no university stake are the most prevalent, comprising 370 (27.6%) of the spinouts. Some of these companies may have a university entity appear on their cap table years later due to the time lag associated with confirmation statements. However, for the 247 or 66.8% of companies in this bracket incorporated prior to the 1st of January 2020, this is unlikely to occur. These companies will be accessing university intellectual property (IP) via licensing agreements. At the other end of the spectrum, 76 companies (5.67%) have their origin institutions holding a 95–100% stake. These figures are dynamic and subject to change, especially for recently incorporated companies, as additional confirmation statements are filed. However, out of the combined 76 companies in the top bracket, 64 or 84.2% were incorporated prior to the 1st of January 2020, suggesting that the university equity stake is unlikely to change.
The Spotlight on Spinouts report gives the average stake taken by universities as 24%, which we have used as a starting point to arrive at a definition of what constitutes a high and low stake for the purpose of this analysis. These definitions are not meant as a statement of Academy policy or recommendation. Figure 1 indicates that it is most common for universities to take a low stake (here defined as less than 15%) in spinout companies, with 56.0% of companies in this category. Meanwhile, universities take a high stake (defined as greater than 40%) in 14.8% of companies.
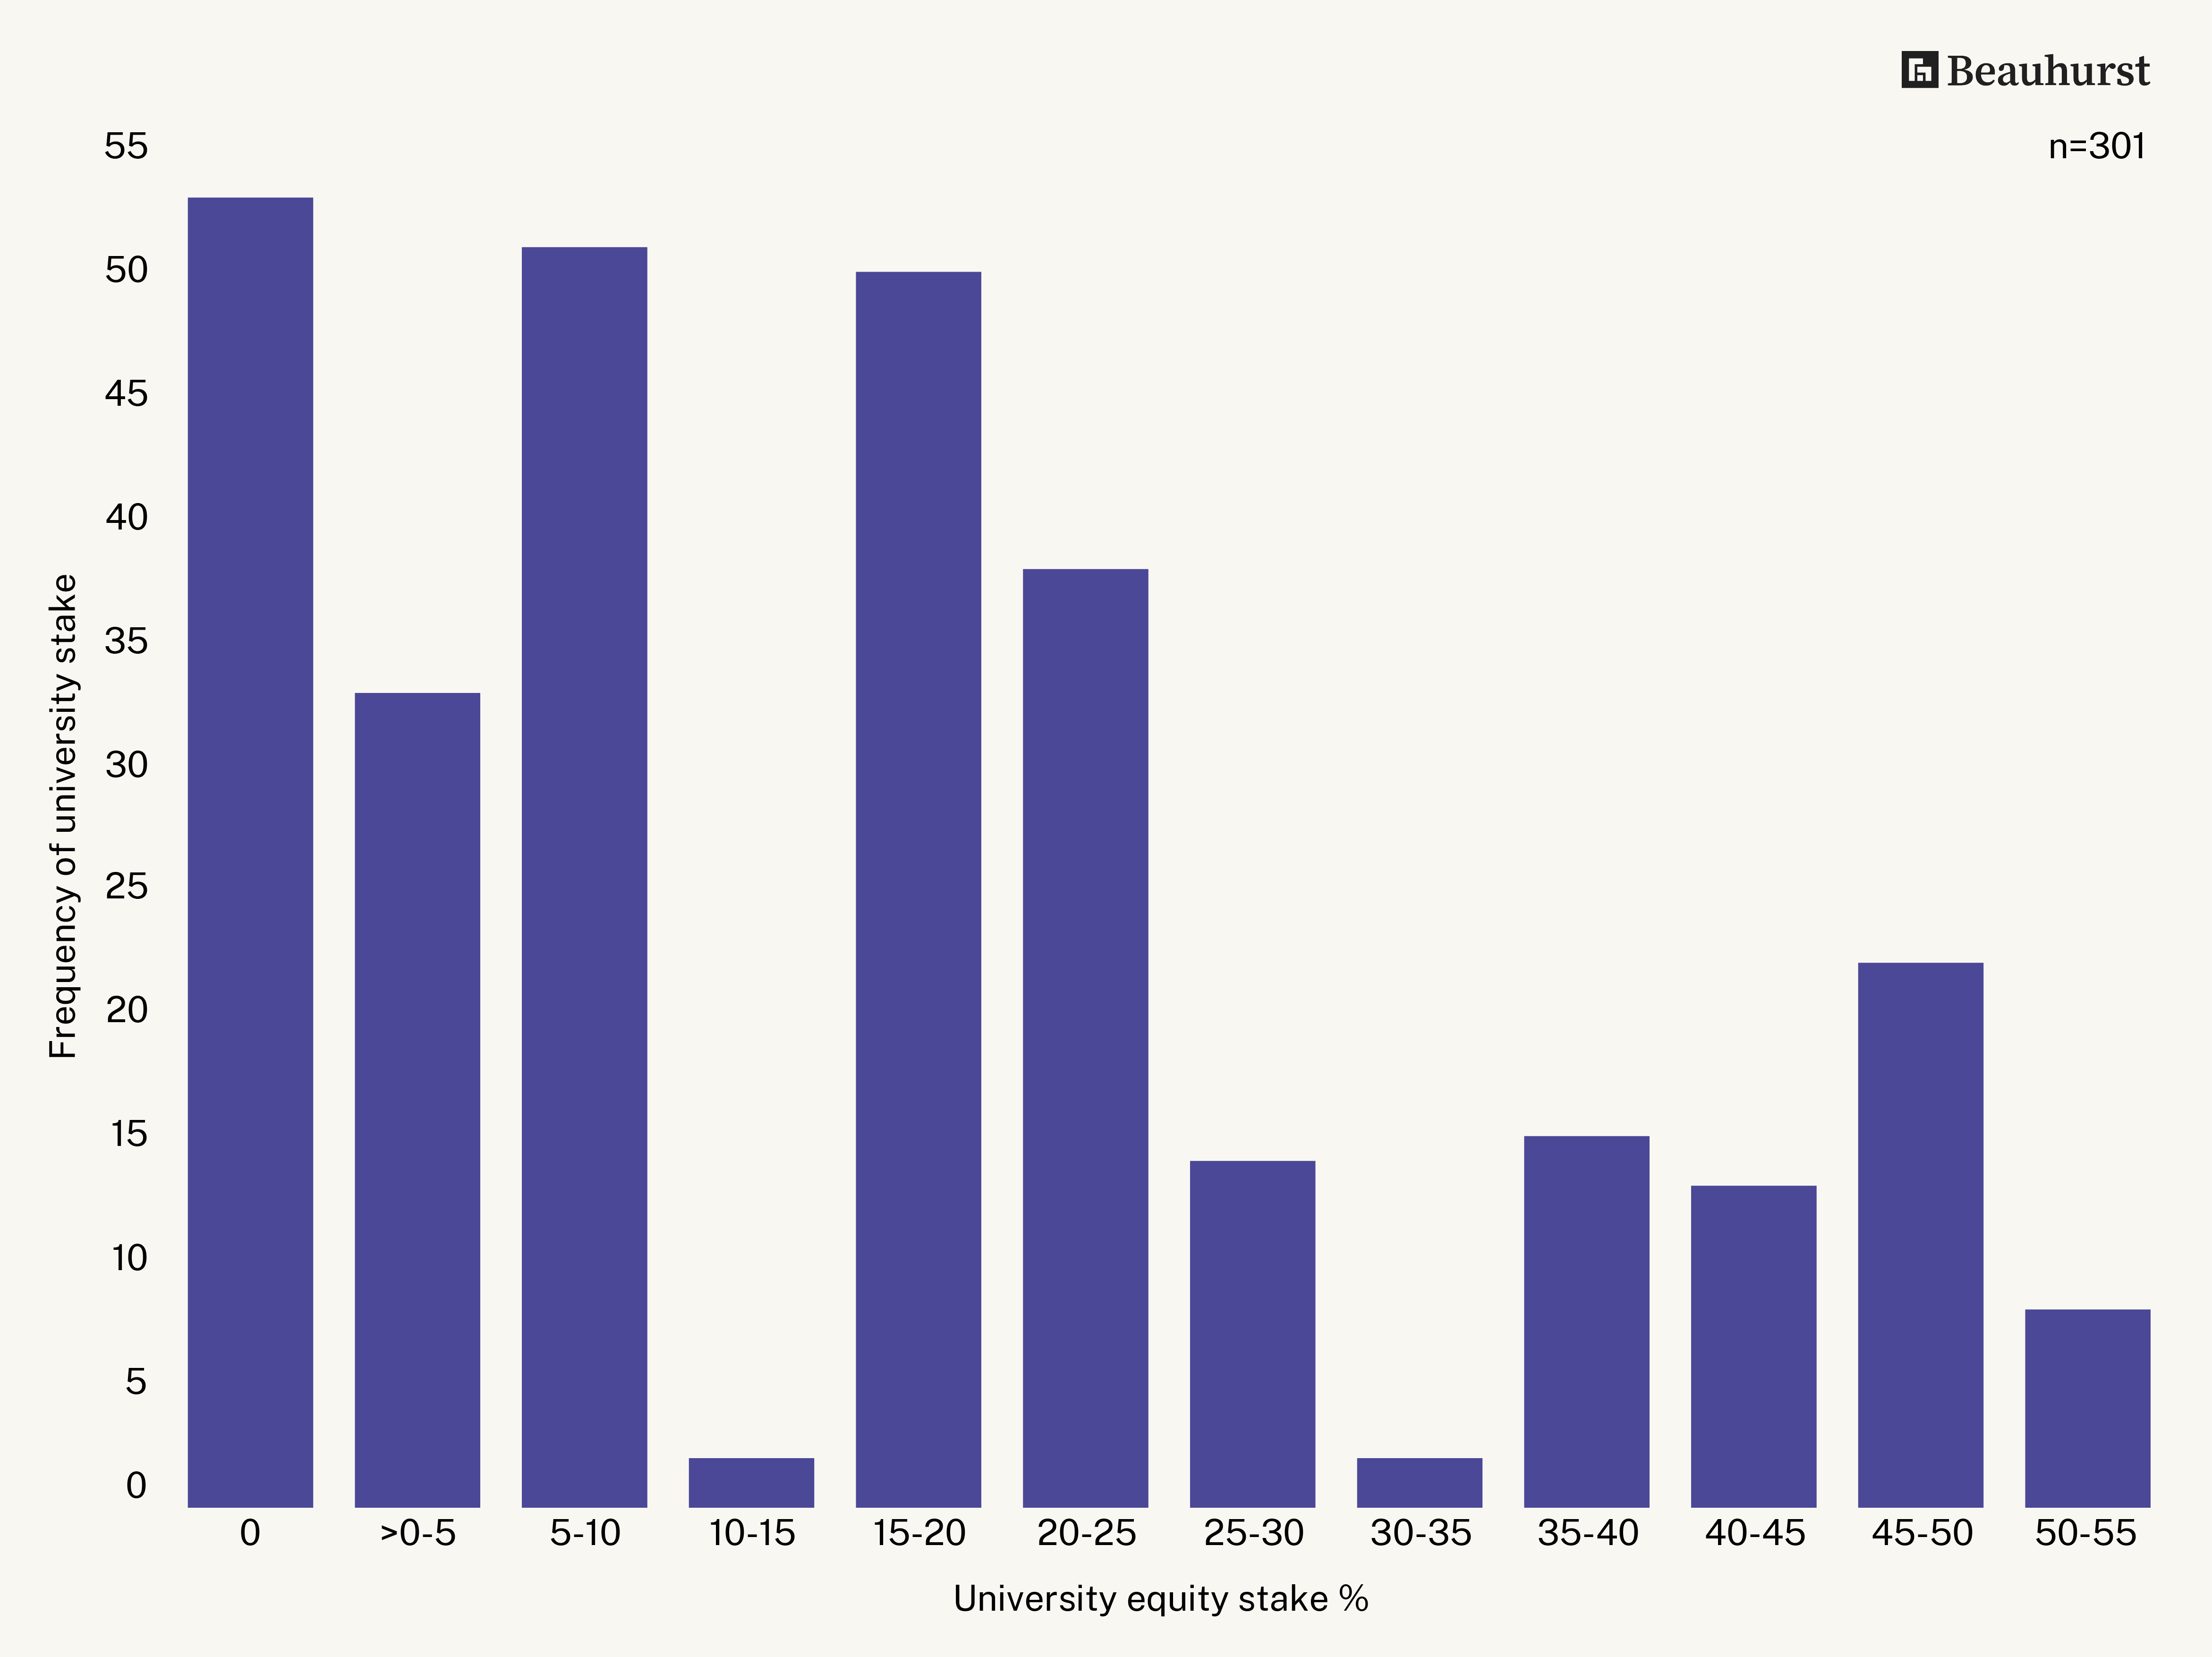
This finding aligns with the Royal Academy of Engineering’s Enterprise Fellowship applicant data, which found that since 2016, 19% of 301 spinout applicants reported that the university sought an equity stake of greater than 40%. From a more qualitative perspective, the application data also reveals that the spinout capitalisation table is one of the more frequently cited criticisms by independent reviewers involved in the selection process. While these findings align with the Beauhurst data, it is important to acknowledge the data has its limitations; it is primarily focused on sectors abundant in intellectual property-rich proposals. Since 2019, the Academy has excluded applications where the university seeks more than a 50% stake. Moreover, the programme’s target audience is academic founders who intend to steer the businesses. Given this niche focus, the findings offer limited insights into the broader sector, only suggesting that high stakes are not a rarity. We include this data here primarily for context, for it was knowledge of this data combined with having encountered the anecdotal views in the opening paragraph that inspired seeking a more robust analysis. The Academy data and the Beauhurst data show that majority stakes are taken by universities, although infrequently.

Figure 2 – Frequency of university stake using the Royal Academy of Engineering’s Enterprise Fellowship applicant data
The shift in university stakes over time

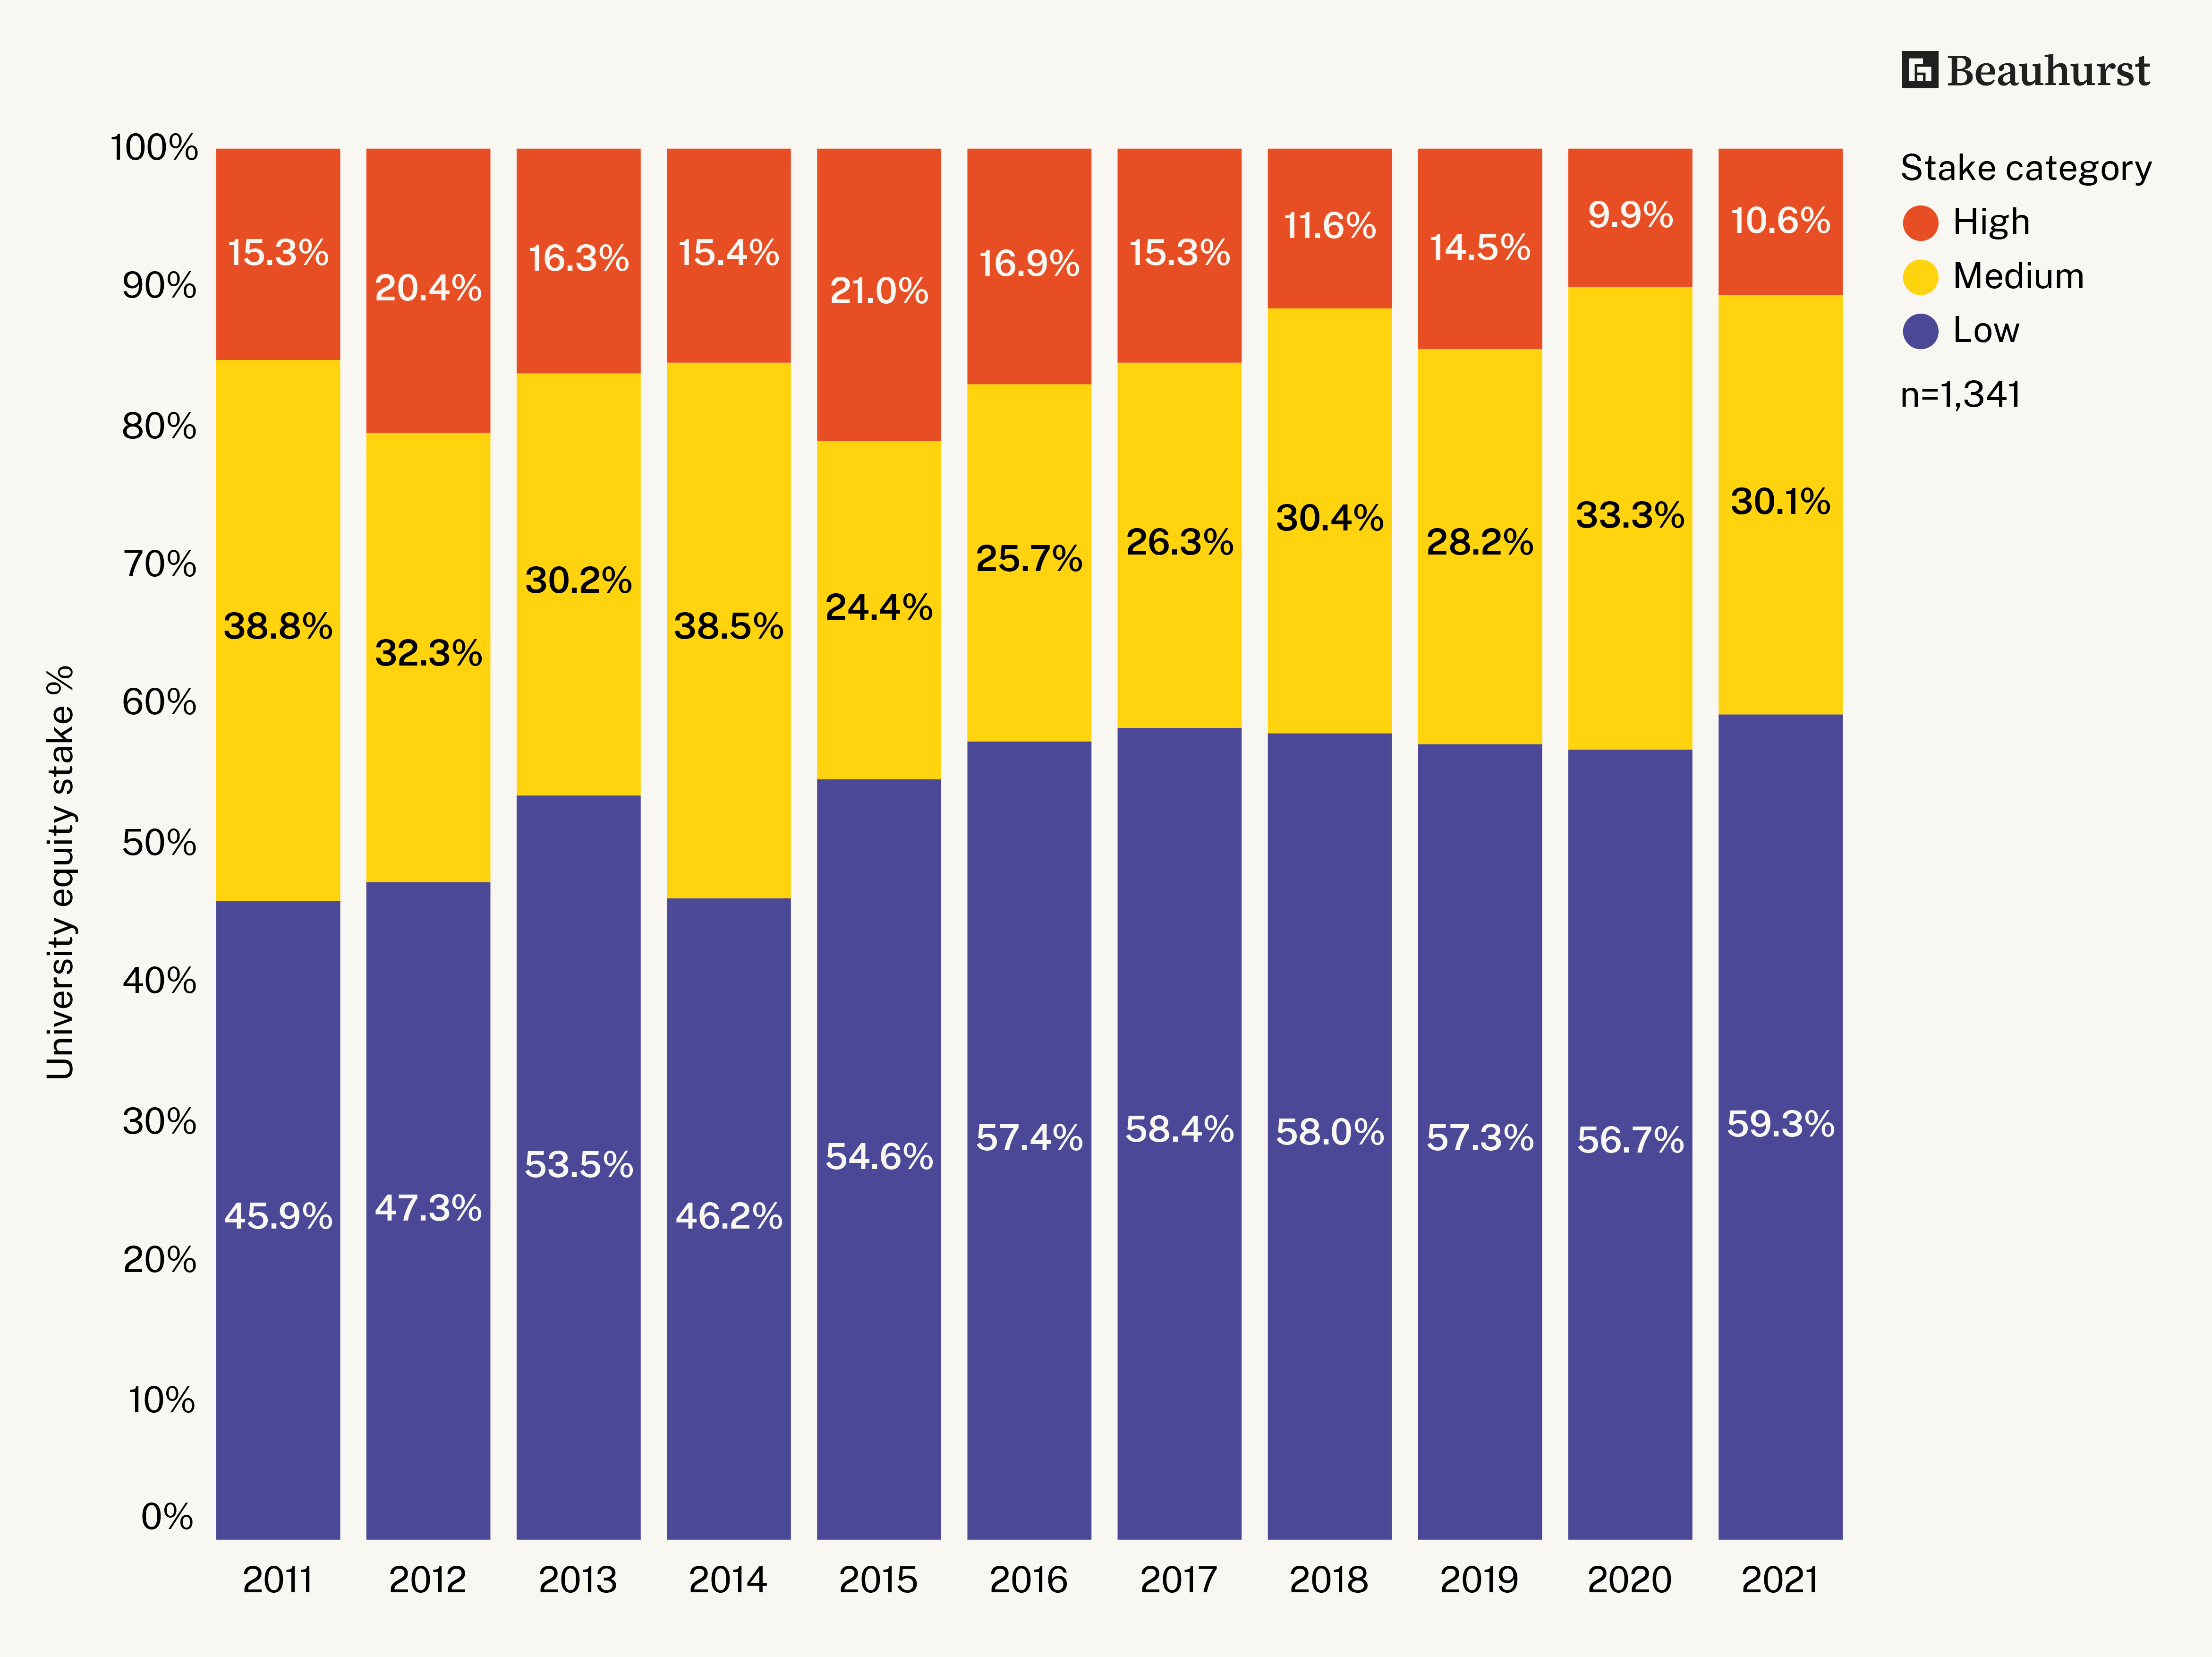
Figure 3 - Distribution of university stakes (2011–2021)
Figure 2 displays the distribution of university stakes for companies incorporated each year, where a low stake is less than 15%, a medium stake is between 15% and 40%, and a high stake is greater than 40%. Data for companies incorporated in 2022 have been excluded from this analysis, as not all confirmation statements were available.
Between 2011 and 2021, the proportion of spinouts where the origin university has taken a low stake has increased from 45.9% to 59.3%. Meanwhile, the proportion of companies where the origin university has taken a medium stake has decreased from 38.8% to 30.1%, and the figure for a high stake has decreased from 15.3% to 10.6%. These findings align with the latest Spotlight on Spinouts report, which found that the mean stakes taken by universities have decreased over the past decade. The data suggests that universities have altered their approaches to equity allocation over the years.
Spinout outcomes and equity stakes

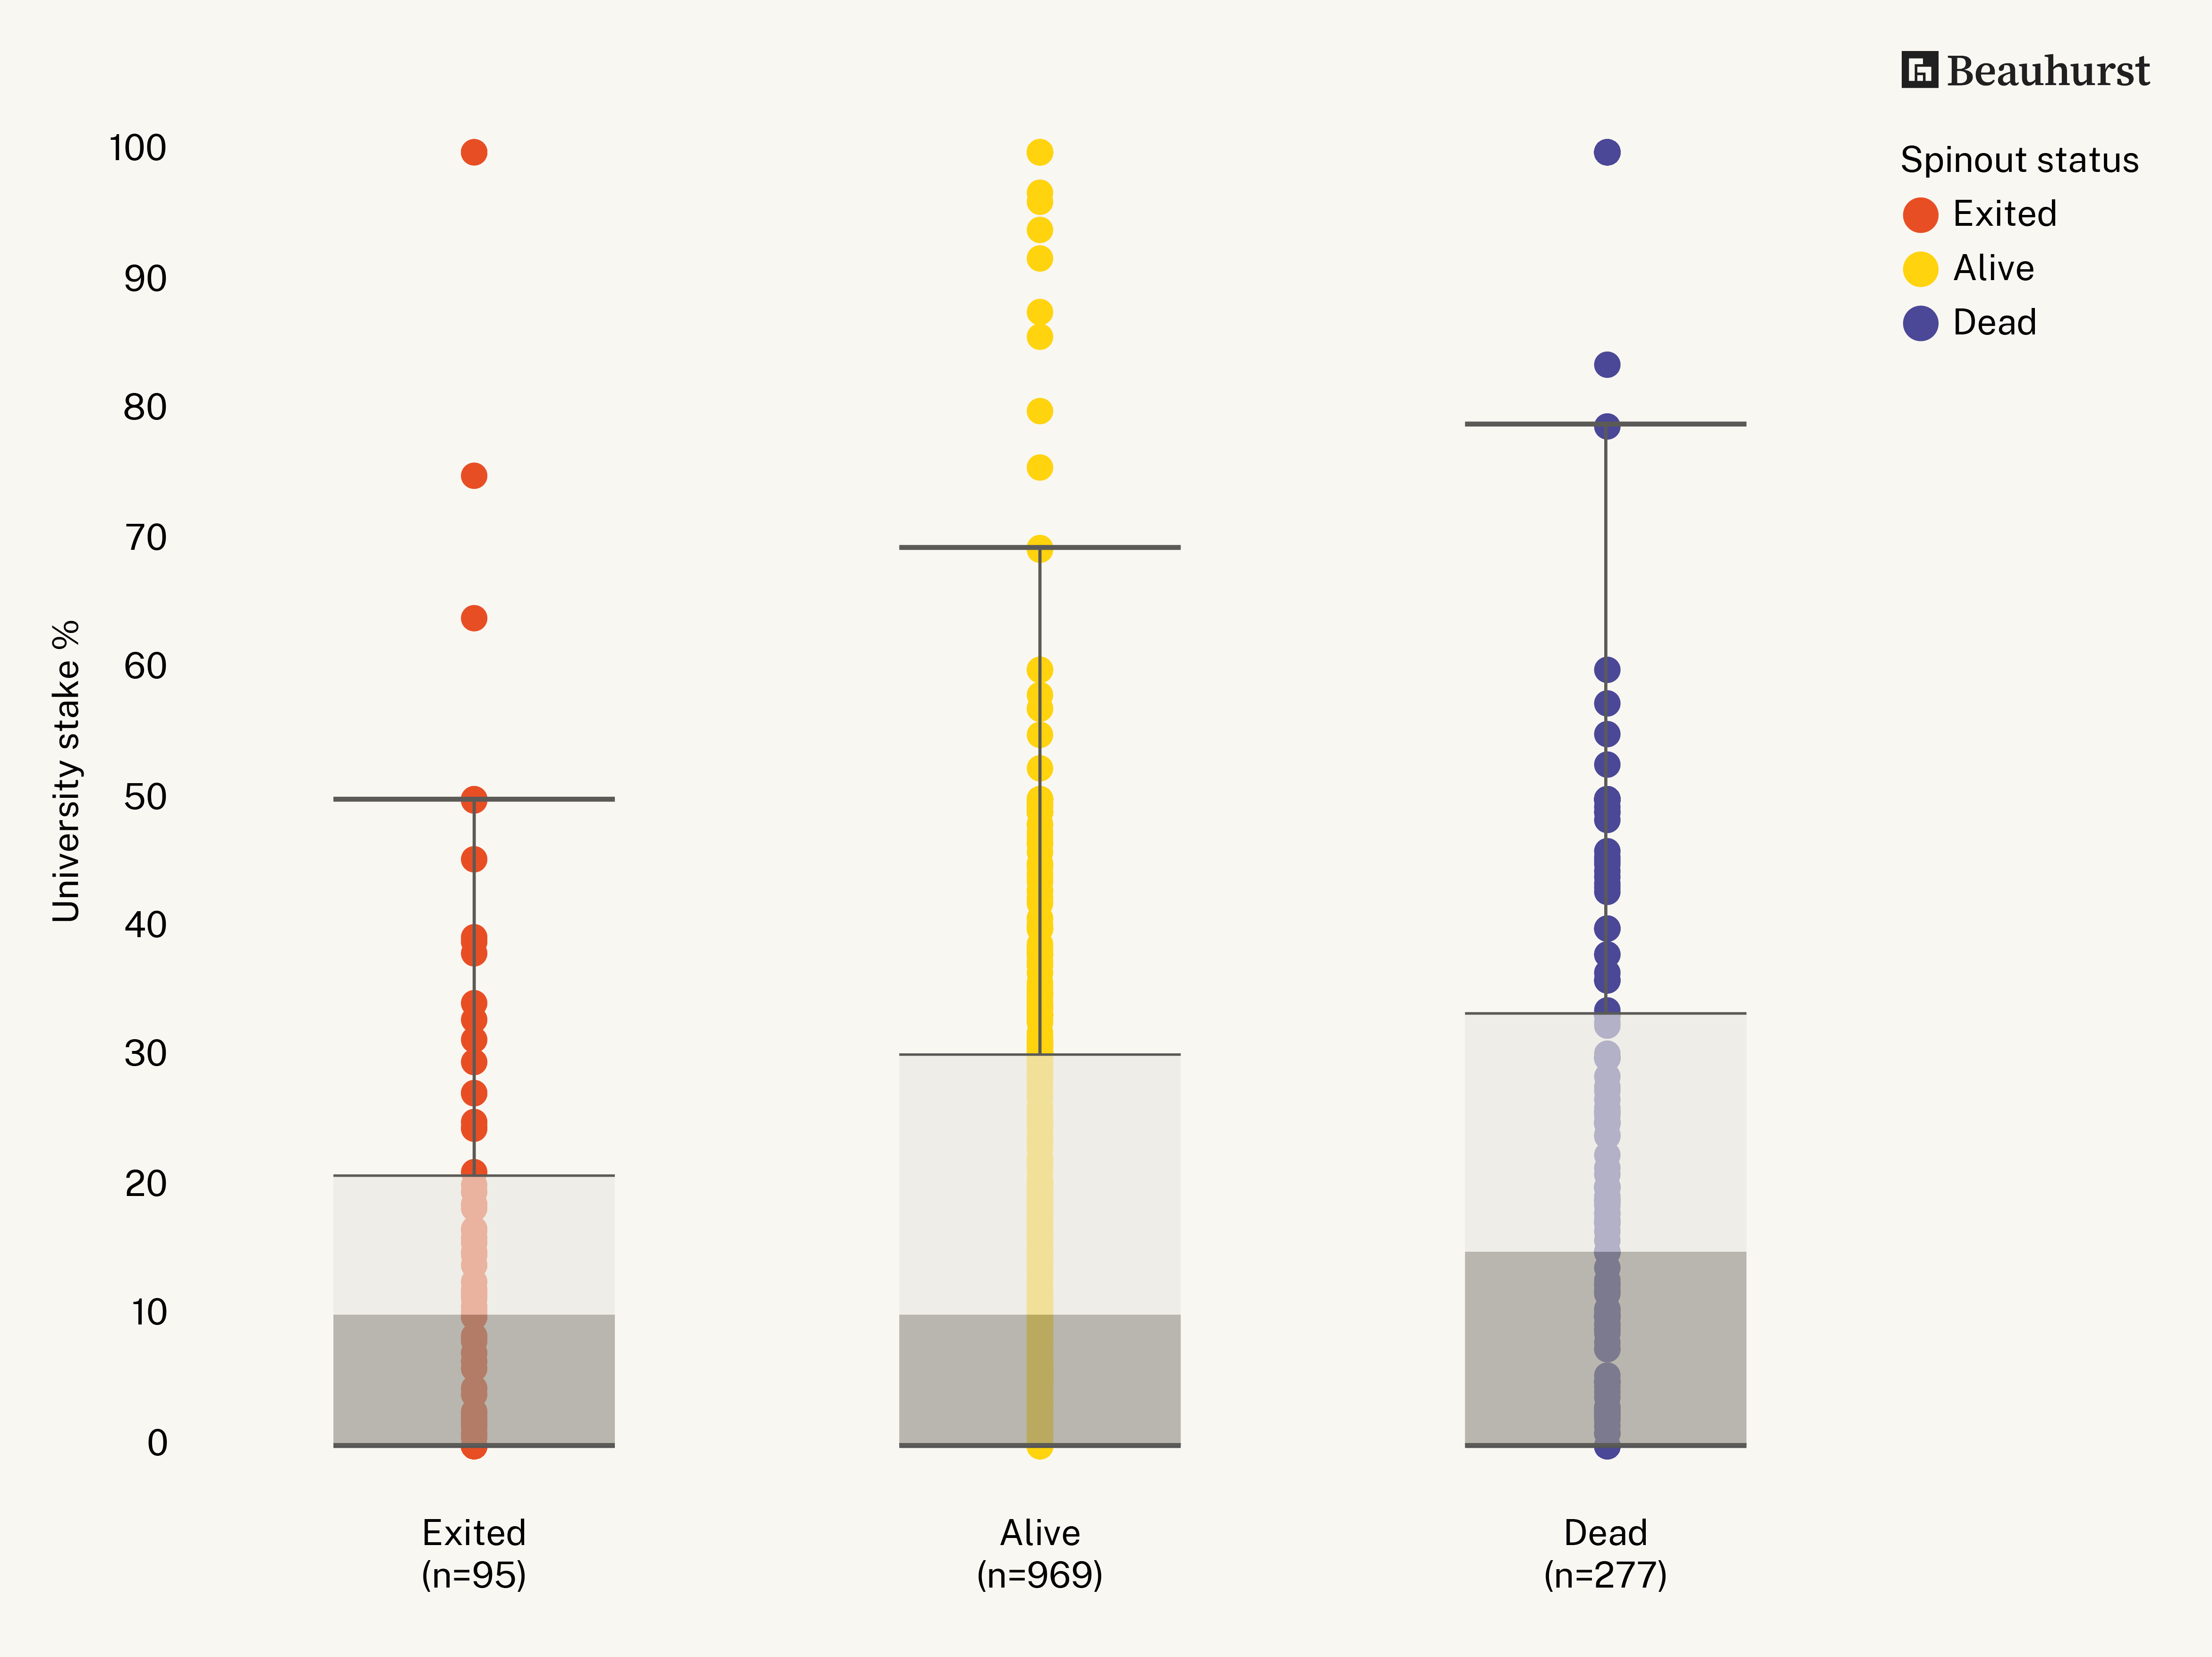
Figure 4 - Spinout status by university stake
Figure 4 shows the university equity taken for three subpopulations of the spinout cohort: companies that have exited; those that have ceased operations or died; and those that are still active or alive. It is a box plot which displays a dataset's distribution through five key data points: the minimum, first quartile, median, third quartile, and maximum while highlighting outliers.
The data shows that dead spinouts have higher median university stakes than exited and active spinouts. The median stake for dead companies is 15%, compared to 10% for exited and dead companies. This suggests that higher university stakes are associated with negative outcomes for spinouts, though the causality is unclear, and there any many factors involved in the success or failure of a spinout. Figure 4 also shows that exited spinouts tend to cluster around lower university stakes, with 50% of all exited companies having an equity stake of less than 20.7% and the overall range of stakes for exited companies spanning from 0% to 50%. For dead spinouts, the range is far larger, spanning from 0% to 78.8%. Splitting the data using the low, medium and high scheme reveals that spinouts with low or medium university stakes have greater survival rates compared to those with a high stake. Of the 751 spinouts with a low university stake, only 14.5% have ceased operations. However, this figure rises to 17.6% for companies with a medium stake and further to 23.6% for spinouts with a high university stake.
A similar but inverted pattern is present in total equity investment by spinout status, with spinout companies with university stakes below 40% attracting greater volumes of equity investment. Of the 1,142 spinouts with a low or medium university stake, 235 (20.6%) secured more than £5.00m in equity investment. For the 199 spinouts with a high university stake, this figure stands at 29 (14.9%).
Conclusion
This analysis reveals a changing landscape, with universities adapting equity allocation strategies over time, as has been suggested in the Spotlight on Spinouts reports. Even accounting for newly incorporated companies that have not filed confirmation statements, the data reveals that a significant proportion of spinout companies have either no university stake or a low stake. This is something that has not received significant attention in discussions around university-spinout dynamics. The data also confirms that universities do take a high stake in a minority but not insignificant proportion of spinouts. Indeed, some are even majority owned by their origin university.
Additionally, there is an indication that lower university stakes seem to attract greater equity investment and improved survival rates for spinouts. However, it should be noted that there are a limited number of companies with a university stake of greater than 50% and so these findings should be interpreted with caution.
The data presented in this article aims to offer a comprehensive view of the distribution of university equity stakes in academic spinout companies incorporated since 2011. As outlined, there are some limitations associated with the use of publicly available data from confirmation statements and the idiosyncrasies of spinout company incorporation. Despite the limitations, it is hoped that the analysis presented here provides a fuller picture of the changing landscape of university spinout equity allocation.
Considering the next steps, additional data is needed for more comprehensive analysis. However, the analysis presented here does prompt several pertinent questions for the community:
- Are the definitions of “high” and “low” stakes used here appropriate, or are we being overly critical or lenient?
- Should we classify companies where the university holds more than a 50% stake as spinouts or subsidiaries, assuming the company's goal is to commercialise university IP?
- How do the equity stakes of the founding team and university influence the likelihood of securing investment funding?
- Under what conditions do universities forego an equity stake in a spinout? In these instances, what wider agreements are in place, e.g. royalties, licensing, ongoing support, and which of these are the most important for the long-term success of the spinout?
This data only reflects those who successfully spin out—but what about those who fail to launch due to a lack of investment? Universities taking a high equity stake undoubtedly impacts the success rate of securing Academy funding, is that true within the private sector? Access to data detailing the reasons for proposal rejection, including the stake as an influential factor, is typically limited to investors. Would investors be willing to share this information, thereby contributing to a broader understanding within the community?
Equally, what are the typical proposals from universities? While an increasing number of institutions publish their spinout policies, we need more data on the extent of their implementation. A survey conducted for the Entrepreneurs Handbook indicated that 76% of founders negotiate terms with the university. If universities were to disclose the initial proposals they submit to investors, as well as the outcomes, what insights might we gain?
The Royal Academy of Engineering Enterprise Hub supports the UK’s brightest technology and engineering entrepreneurs to realise their potential.
We run four programmes for entrepreneurial engineers at different career stages. Each one offers equity-free funding, an extended programme of mentorship and coaching, and a lifetime of support through connection to an exceptional community of engineers and innovators.
The Enterprise Hub focuses on supporting individuals and fostering their potential in the long term, taking nothing in return. This sets us apart from the usual ‘accelerator’ model. The Enterprise Hub’s programmes last between 6 and 12 months, and all programmes give entrepreneurs lifelong access to an unrivalled community of mentors and alumni.
Our goal is to encourage creativity and innovation in engineering for the benefit of all. By fostering lasting, exceptional connections between talent and expertise, we aim to create a virtuous cycle of innovation that can deliver on this ambition.
The Enterprise Hub was formally launched in April 2013. Since then, we have supported over 350 researchers, recent graduates and SME leaders to start up and scale up businesses that can give practical application to their inventions. We’ve awarded over £11 million in grant funding, and our Hub Members have gone on to raise over £1.3 billion in additional funding.
